The financial writer Morgan Housel wrote a few years ago about two types of investing knowledge.
There’s expiring knowledge that comes at us in firehose fashion primarily through the daily “news”.
There’s also what Housel terms long-term knowledge that primarily comes through reading books.
He notes:
“Expiring knowledge catches more attention than it should, for two reasons. One, there’s a lot of it, eager to buzz our short attention spans. Two, we chase it down, anxious to squeeze out insight before it loses relevance.
Long-term knowledge is harder to notice because it’s buried in books rather than blasted in headlines. But its benefit is huge. It’s not just that long-term knowledge rarely expires, letting you accumulate it over time. It compounds over time.
Expiring knowledge tells you what happened; long-term knowledge tells you why something happened and is likely to happen again. That ‘why’ can translate and interact with stuff you know about other topics, which is where the compounding comes in.”
Long-term knowledge, we believe, helps provide the first principles of investing—how the economy and markets “work”.
Even though expiring knowledge can have a short shelf life, it cannot be ignored. The economy and commerce are dynamic. Potentially significant change may well start as expiring knowledge.
We believe the probability of investment success is significantly improved by evaluating the significance of today’s expiring knowledge through the lens of first principles (long-term knowledge).
For example…
Yardeni’s List
On numerous prior occasions we have noted that the Financial Panic of 2008 was a seminal event for investor psychology.
Fear, Uncertainty and Doubt (“FUD”) about many aspects of investing and economics increased in the wake of the housing boom gone bust and related events of 2008.
The impact of 2008 on investors psychology is understandable. After all, the financial system back then came dangerously close to melting down in a manner not experienced since the Great Depression.
Fortunately, the Federal Reserve of 2008 had learned from the grave mistakes of their 1930s’ “Fed” counterparts. In the heat of the 2008 Panic, the Fed fulfilled its lender-of-last-resort role and prevented a financial system collapse.1
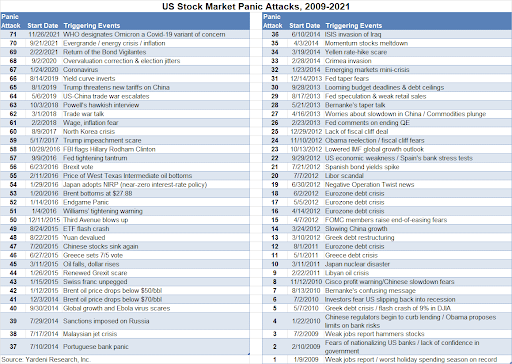
While the Fed’s actions helped stem the panic, deep-seated general anxiety continues to linger. Since the start of 2009, economist Ed Yardeni has been keeping a list of events that have triggered episodes of pervasive, heightened investor FUD. Yardeni’s “panic attack” list is on the next page.
About the list he notes:
“These are my subjective picks. A few of them have triggered full-fledged (stock market price) selloffs, when the (U.S. stock) market declined 10%-20%. Most have caused minor stock selloffs but were accompanied with lots of fear that they might lead to stock ‘bear’ markets. All of them turned out to be (stock) buying opportunities.”
Count on an addition to the list very soon
There are currently 71 entries on Yardeni’s list. Having them all fit on one page requires print so small it’s hard to read the entries.
That’s Yardeni’s point, however. The list is a reminder that there are always plenty of things to worry about. And it’s also a reminder that many—perhaps most—of the worries that can dominate the headlines and our attention for days and weeks will also likely be expiring knowledge—difficult to even remember when looking back a short time later.
As we have noted in the past, the dynamism and adaptability within the U.S. economy are significantly underestimated. (One of our first principles of the U.S. economy.) Problems create opportunities to provide solutions. Each day millions of minds are busy thinking of ways to solve today’s problems. Adaptability and dynamism are often what makes life better, making some of the expiring knowledge “expire”.
Still, today’s “news” is filled with issues that may trigger intense investor FUD; tensions with Russia, China, and Iran, COVID-19 variants, a polarized Congress and country, the growing budget deficit, plans for huge fiscal spending and tax increases, mounting regulatory burdens, supply chains disruptions, stagflation, stock price valuations, and the Fed signaling it’s going to hike interest rates.
These are all legitimate concerns. One or more will likely trigger significant financial market volatility and become another addition to Yardeni’s list.
What is likely to be the next addition to the list?
If one were to review Yardeni’s list with a magnifying glass, you would find that issues surrounding the Fed were a frequent source of the FUD events on his panic attack list.
Investors are hyper-sensitive to Fed policy changes. Perhaps overly sensitive.
Back when Alan Greenspan was Fed Chair, some on Wall Street thought the thickness of the briefcase Greenspan carried to Fed meetings foretold changes in Fed Policy. The thicker the briefcase, the greater chance the Fed would soon be raising rates was the theory. So, some Wall Street Fed watchers would try to catch a glimpse of Greenspan’s briefcase and gauge whether it was “thick” or not.
Yikes, talk about hyper-sensitivity!
The current Fed is now “pivoting” to a less stimulative policy tilt. They have announced they will be scaling back the bond market liquidity injections that they initiated in the heat of the pandemic shutdowns of 2020.
Minutes from their most recent meeting also suggest they expect to soon raise those interest rates under their control. Market expectations are for 100 basis points of rate hikes (rates going from nearly 0% to 1%) accomplished in four installments.
Increases in market volatility in recent days suggest that events surrounding Fed policy may well be the source of another episode of FUD intensification for Yardeni’s list.
Fed policy change context
A shift in Fed policy shouldn’t be a real shocker. The emergency policy stance adopted to help counter the COVID-19 shutdowns is no longer needed with the economy recovering.
Experience suggests to us that when the Fed embarks upon a pivot like the one presently underway, market expectations tend to overestimate the number of rate hikes that end up occurring.
We also note that even if the now widely forecasted interest rate hikes do occur, interest rates will likely remain at low levels relative to history. The economic expansion does not appear at risk of slipping into recession.
General corporate earnings growth should also continue to grow—although at a significantly slower pace (around 8%+) than 2021’s re-opening distorted advance (40%+). Rising earnings should help provide support for stock prices.
We want to be crystal clear about the Fed’s importance. Anyone that doubts the power of their policies need only look at their Great Depression policy mistake.
Or their “fool-in-the-shower” policy implementation during the inflation prone economy of the 1970s. (Economist Milton Friedman described fool-in-the-shower policy as the Fed wildly jerking policy between “too hot” and “too cold” extremes.)
One cannot be complacent about the power of Fed policies. But it’s also important to note that the Fed (or politicians in Washington D.C. or within statehouses) cannot create real economic growth or wealth.
First principles tell us that the wellspring of economic growth is innovation. Commercialized innovation drives productivity growth. And productivity growth drives the standard of living higher.
Most innovation occurs in the private sector. It’s the result of the millions of minds working to solve the problems of everyday life as we noted earlier.
As technology analyst Azeem Azhar concisely summarized innovation in his recent book:2
“Modern history is defined by two great forces: the extraordinary power of technological change; and humans’ ingenuity in forging the world we want in response.”
While the Fed is important, first principles also tell us to consider things within the context of another very powerful force in the U.S. economy—the innovators.
How inflation prone is the U.S. economy?
 Every day innovators are intensely focused on things that will help mitigate inflationary pressures.
Consider:
- Technology and the emergence of the digital economy are generally deflationary forces.
Bits and bytes businesses scale rapidly without needing lots of loans or physical assets. Industrial Era companies were/are governed by diminishing economies of scale (their costs of producing a product rise beyond certain production limits). Digital businesses suffer no such limits and typically realize increasing economies of scale. (Once a piece of software is created, the marginal cost to produce another copy is essentially nil.)
A great number of new digital productivity enhancing tools have become available—increasingly as a modestly-priced monthly subscription. These tools enable businesses to operate more efficiently in an “asset light” manner
The asset light trend is sometimes called dematerialization—economic growth without commensurate growth in resource utilization. Dematerialization is a relatively recent phenomenon, and its implications, we believe, are not yet widely recognized.
Dematerialization is about getting more from less. It probably is most easily conveyed by the nearby graphic which shows all the physical goods a smart phone has replaced.
Other examples where emerging technologies dampen inflation include:
- A monumental change in the conventional energy markets. Whatever one’s opinion about fracking may be, there is no denying that it has reduced U.S. dependence on, and vulnerability to, OPEC. During the 1970s oil embargo, Americans spent about 10% of their disposable income on energy. Today it is less than 4%—near an all-time low.
- E-commerce, which continues to grow, is also restraining the rate of inflation. The following quote from economist Austan Goolsbee reinforces this point.3
“I helped Adobe Analytics create a measure of online inflation analogous to the government’s Consumer Price Index (CPI). Using anonymized data from Adobe’s marketing analytics division, we examined more than one trillion online transactions made between 2014 and 2017. We found annual online price inflation averaged almost 1.5 percentage points lower than the equivalent CPI.
Over the past 12 months, that gap has likely widened. Adobe’s latest release found online prices over that interval to be (‘only’) 3.5 percent higher – more than three full percentage points below the headline inflation rate of 6.8 percent. In November, online prices fell 0.2 percent as the CPI rose 0.8 percent.
In other words: The more someone shops online, rather than in stores, the less inflation the individual faced.”
In addition, we believe demographic trends have made the economy less inflation prone:
- The overall population in the U.S. is projected to grow slowly. The rate of growth in demand for good, services, and loans is significantly less than was the case with the baby boom. As we’ve discussed on prior occasions, the sheer size of the baby boom generation persistently stressed the supply side of the economy rendering the 1970s’ economy inflation-prone.
- In the rest of the developed world (including China), populations are either declining or will do so in the relatively near future. Declining populations are a deflationary force for the world economy.
Some upward price pressures are temporary
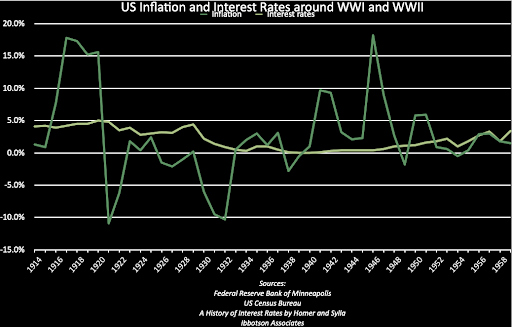
Last quarter, we made the case that the disruption to the global supply chains due to pandemic shutdowns was unlike anything experienced since the end of World War II.
At World War II’s end, the goods production side of the U.S. economy had to undergo a massive adaptation adjustment. Production needed to move from building items for war (tanks, ships, guns, etc.) to building consumer goods.
The pivot back to private sector goods production was a process that took time to unfold. Inflation surged as pent-up demand outran the speed of the ramp-up in private sector goods production.
Chart 1 tracks inflation trends around World War II…and we also added the period encompassing World War I when a similar post-war goods adjustment process occurred.
Post-war inflation was significant, but temporary, in both instances.
The economy of today is much different than it was in those earlier periods. But the “take-away” from these earlier periods is that inflation from events that temporarily overwhelm production eases when the goods production process and underlying supply chains are restored.
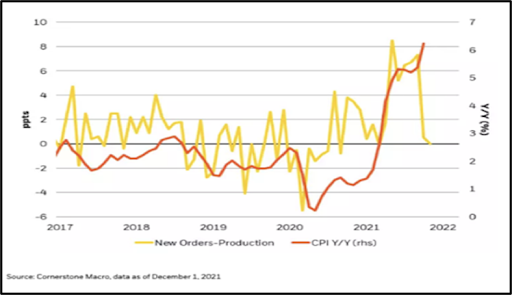
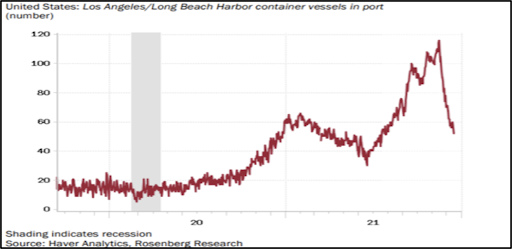
Encouragingly, there are incipient signs that supply chain pressures are easing. See Chart 2 and 3 nearby.
We also thought a recent report by the accounting firm KPMG on the used-car market might be of interest.
KPMG wrote:
“A massive demand/supply gap has been disrupting global auto markets for the past year. The media are reporting exorbitant prices U.S. car dealers are getting, especially for used cars: the Bureau of Labor Statistics used-car CPI jumped more than 40% from December 2019 to October 2021. Car prices are a major contributor to the biggest surge in inflation in the U.S. in three decades.”
“History tells us the current frenzy in the used-car market will come to an end. [Computer] chip suppliers will catch up with demand, supply chains will unclog, and the massive auto manufacturing machine will shift back into gear. When that happens, used-car prices could collapse.”4
Economist Alan Reynolds notes:
“[Recent] Headlines reported an alarming 45% rate of “inflation” in used-car prices, as if it was part of a sustainable trend. At that pace, the used-cars market would become more valuable than new cars by June 2022—an impossible trajectory.”5
An article from The Investors’ Business Daily also reported on this dynamic within recent CPI releases:
“Prices for durable goods, such as autos, appliances and computers have valuated 14.3% over the past year. That alone added 1.7 percentage points to the [overall] CPI rate.”6
Inflation may remain above the Fed’s 2% goal. Some economists are speculating the Fed will move their inflation goalposts to 3%. They may.
But some relief from supply chain price pressures, and an economy that is not structurally inflationary, should allow the Fed FUD that’s accumulating to simmer down over the course of the next few quarters.
Slow real (after inflation) growth dynamics
In addition to the slow population growth trends that we discussed earlier, there are other factors that likely will weigh on the pace of the economic upturn.
We are optimistic that innovation in the U.S. is alive and well. We hear about it on every company conference call in which we participate (multiple dozens each quarter). This bodes well for private sector productivity growth, real (after-inflation) economic growth and the general standard of living.
However, we expect the continued expansion of the government into economic activities will be a wet blanket on overall growth. Chart 4 reflects that the trend towards “big and bigger” government is not just a U.S. phenomenon.
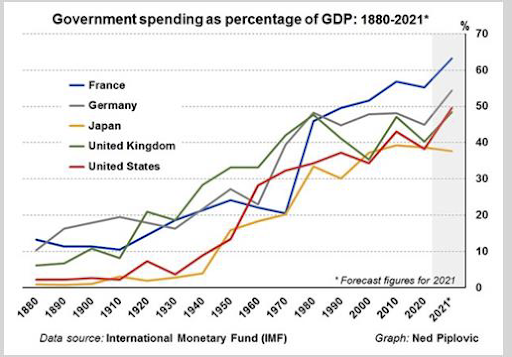
Economist Mark Skousen—author of several first principles economic books—notes: “Empirical studies have shown an inverse relationship between the size of the government and economic growth”. In other words, the bigger the government, the slower is economic growth. The U.S. economy is a mixed economy; resource allocation occurs by both the private sector and government.
Within the private sector, resource allocation occurs primarily through mutually beneficial trade. Dynamic adjustments guided by competitive pressures and feedback loops provide important signals (profits and losses) that drive adaptation characterize private sector commerce.
By design, government economic resources are allocated in a very different manner. Competition and feedback loops generally are not what guides the allocation process. Whether one thinks this is a good or bad thing is certainly not for us to say.
But, first principles indicate that as more of an economy’s resource allocation decisions are made through less-efficient government “top down” processes, slower productivity growth is typically the result. And recall, productivity growth is what ultimately drives the standard of living higher over time.
A wet blanket impact on economic growth may not seem to matter all that much in the short run. However, like Housel’s observation that long-term knowledge tends to compound over time, the wet blanket impact compounds over time.
An economy growing at 3% means that the standard of living doubles in about 24 years. A 2% growth rate extends the time until doubling to 36 years. We submit that the 1% difference in growth is 12 years of slower standard of living progress is not an insignificant period in peoples’ life spans.
So, where does all this take us investment-wise?
Investment Strategy
Bonds: With U.S. Treasury yields well below 2021’s inflation, the bond market appears to be reflecting the expectation that current inflationary pressures will not become entrenched.
Bond prices would likely “take it on the chin” if higher rates of inflation prove to be a long-lasting problem and bond yields are forced higher. (For bonds trading in the marketplace, higher bond yields means lower bond prices.)
Our analysis has suggested for some time that bonds generally have a poor risk/reward profile—even if inflation remains at or below the Fed’s target rate of 2%.
As a result, we continue to maintain a “defensive” structure in our bond investments. Interest rate risk exposure within bond holdings remains very modest. Higher bond yields would be viewed as potential opportunity.
Stocks: Over time, we believe one of the most enduring first principles of investing relationships is the link between a stock price and the earnings power of the underlying business. Stock prices follow the earnings prospects of a business.
The role of the stock market is to allocate capital to its “highest and best uses”.
More simply: over time a business with strong earnings growth becomes worth more. The stock of a struggling company, in contrast, typically struggles as an investment.
Companies compete for customers. Strong earnings growth is the result of providing goods and services that please customers by making their lives better and easier by helping solve some customer problem(s).
These aspects endure whether a low or higher inflation environment exists. In the latter case, our research of past episodes of escalating rates of inflation suggests that ownership of businesses that can consistently generate earnings growth in their businesses, above the rate of inflation, prove to be very rewarding investments.
As one investment manager put it:
“…there is one truism that will always protect your assets against inflation—own things that provide value to humans. If you own things other people will want, no matter what is happening in the world, then your purchasing power is likely to remain intact.”7
The businesses we own include many that provide productivity enhancing tools to other businesses. These tools are, in many cases, essential to their customers’ businesses.
Rising inflation puts additional burdens on firms to run as efficiently and productively as possible to counter rising labor and other input costs. We believe demand for productivity tools would be sustained and plausibly could increase in such an environment. Expanding addressable markets will help power the earnings growth of our portfolio companies.
Furthermore, if inflation proves more enduring than we suspect will be the case, Fed policy to combat entrenched inflation would take a toll on the economic expansion. Strong earnings growth would become relatively scarce. Investors in stocks of companies that would be able to sustain earnings growth at a superior pace would likely be well rewarded.
The businesses we own have been selected for the superiority and durability of the growth prospects of their underlying businesses. In addition, portfolio companies have exceptional financial flexibility which provides them with the ability to further enhance their businesses by being able to take advantage of opportunities that often are created during episodes of intense FUD.
To close, we want to reiterate our belief that innovation and demographics are reshaping the economy’s structure. Some of the implications of these forces are percolating through the expiring knowledge of the daily headlines.
But much of the expiring news is generating FUD that obscures the important investment implications and opportunities that lie ahead.
Viewing the world and the markets through the lens of first principles of long-term knowledge remains the pathway to rewarding returns. It will be a bumpy pathway—always is—but the investment rewards will be worth it.
Appendix
Stock valuations of superior companies
Some of the investment FUD headlines concern stock valuations. Here’s our take on this topic.
The stocks of superior businesses typically trade at premium valuations compared to stock of the “average” company.
As a portfolio, the price of our stocks trade at a premium valuation relative to the stock market as measured by the conventional measuring stick used on Wall Street. (P/E ratio: stock price divided by a company’s earnings per share.)
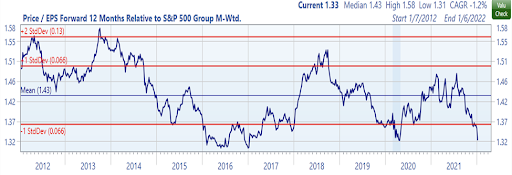
The following chart calculates the size of the premium (blue line) of our holdings over the past few years. There are many dynamics within the chart, but we won’t trouble you with the details. (Call us, we’re happy to discuss this “stuff” at length!)
The key point we want to convey is that when the blue line is near the top of the chart, the superior company stock premium is larger, and when it’s near the bottom, the premium is lower.
At present, the premium is near the bottom of the chart. A compressed premium suggests to us that FUD about valuations of superior businesses’ stock prices is already reflected within the stock market.
Sources & Notes
1The Fed was formed in 1914 after the Financial Panic of 1907 created the desire for a lender-of-last-resort. Leaders believed a central bank patterned after the Bank of England, which had a long history of quelling financial panics, was necessary. Unfortunately, the 1930s’ Fed failed miserably in the heat of the battle and that financial panic morphed into the Great Depression.
2The Exponential Age: How Accelerating Technology is Transforming Business, Politics and Society, by Azeem Azhar, Diversion Books 2021
3“The Missing Data in the Inflation Debate”, Austan Goolsbee, New York Times, December 30, 2021
4“Used car prices could crash—will they?”, KPMG, 2021
5“Inflation in oil prices will soon slow to zero”, Alan Reynolds, AIER, January 11, 2022
6“Impact of Auto, Goods Prices”, Investors’ Business Daily, November 29, 2021
7“How to Invest Your Money When Inflation is High”, Nick Maggiulli, ofdollarsanddata.com, November 11, 2021