Strong corporate earnings growth is sometimes very scarce, like diamonds. At other times, it’s like pears or apples during a strong harvest—abundant and easy to find.
We heard this above commentary many years ago from a stock analyst. Certainly, seems that the corporate results of 2020 and 2021 will—barring serious setbacks in progress against the pandemic—reflect both extremes of this characterization.
The COVID-19 recession of 2020 created an environment that threatened the health of many citizens, the economy, and businesses. For stock investors, that environment created diamond-like scarcity conditions for strong corporate earnings growth.
The stock market’s advance for most of 2020 was powered by the stocks of a relatively small number of companies. These companies had underlying secular growth dynamics that allowed them to navigate through the economic headwinds associated with COVID-19. (We are pleased, by the way, to have investments in companies that possess such durable growth attributes).
As the first COVID-19 vaccines were approved for emergency use in the U.S. last autumn, and as policymakers continue to be “all-in” (and then some!) with fiscal and monetary stimulus, the stock market advance broadened out.
The broadening reflected widespread belief that the economy’s re-opening will enable harvest-time, strong recoveries in economic growth, and overall corporate earnings.
How strong will things be?
Many economists are forecasting boom-like growth for the overall economy this year, the likes of which have not been experienced for decades.
General corporate earnings growth—which over time has followed roughly a 6-7% trend, may well stage a recovery growth rate of 25%+ in 2021.
The hardest hit industries by the pandemic (travel, brick and mortar retailers, sit-down restaurants, highly cyclical companies and/or highly-indebted companies) may well register “off the charts” earnings results this year as their 2020 business begins to recover.
Harvest time indeed!
A turning point at hand?
How long will harvest time last? Some pundits think a “roaring 20s” is ahead.
They cite conditions resembling those of the 1920s when the economy recovered from the 1918 Spanish Flu pandemic (and World War I). This earlier time was also a period when many innovations (a short list includes electricity, radio, and autos) made their way into daily life and drove a multiyear stretch of robust (5%+ per annum) productivity growth that also drove the overall standard of living higher.
Here are considerations for 2021:
- Cash-flush consumers have significant spending power and pent-up demand for services like travel and leisure as noted above.
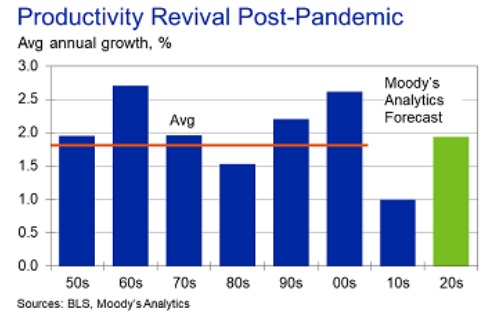
- As we discussed in an edition of our third quarter Perspective last year, the COVID-19 recession became the impetus for “super-spreading” digital productivity enhancing tools throughout the economy. We’ll discuss the digital transformation in a bit more detail in a later section, but it’s notable that some forecasters foresee productivity gains ahead (see Chart 1 below) as digital innovations continue to make their way into the economy.
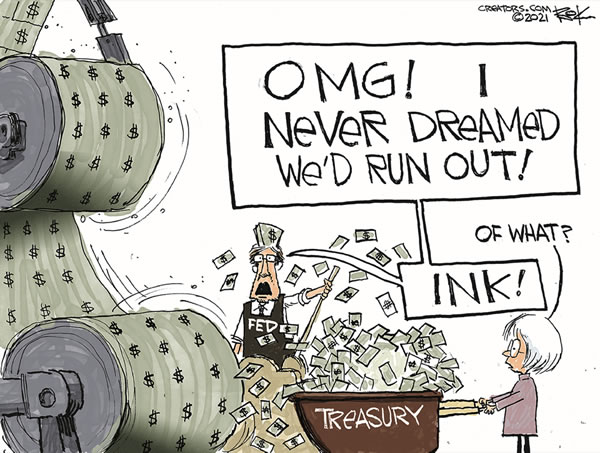
- The Federal Reserve (“the Fed”) continues to signal that it is not inclined to take its foot off the monetary gas pedal anytime soon even as the economy and its money-supply measures surge. (Ditto for nearly all the Fed’s global counterparts, by the way).
- The new Administration’s “big and bold” agenda did not end with the most recent round of stimulus checks. Additional “stimulus” spending plans being crafted may well rival Lyndon Johnson’s 1960s “Great Society” spending spree or, possibly, FDR’s “New Deal” initiatives in the 1930s.
Chart 1: Digital tools are driving productivity higher
Other pundits are worried that all the stimulus—with more likely on the way—will cause the economy to “overheat”. With bad memories of the economic dysfunction prevalent during The “Great Inflation” (as it is now called), of the late 1960s through the early 1980s, there is understandable worry that inflation is at a turning point towards becoming serious trouble.
For our perspective on these and related investment topics read on.
Cyclical versus long-term trends
It is helpful to distinguish between longer-run trends and cyclical trends. As Chart 2 below suggests, the long-run trend in the U.S. has been for the economy to grow over time.
But, as the chart reflects, within the longer-run growth trend there are “business cycles”—periods of growth interrupted by recession (vertical shaded bars).
Chart 2: Picture within the big picture; business cycles exist within the long-run growth pattern
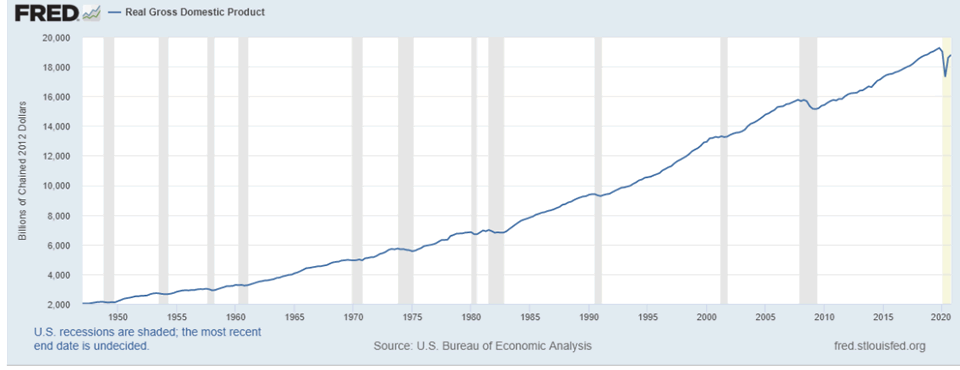
Typically, above-average growth is experienced coming out of recessions. Ultimately, growth slows as it reconnects with the underlying and ultimate determinants of economic growth (trends in the size of the work force growth and productivity).
The diamonds, apples, and pears at harvest time characterization we led off with is suggestive of cyclical trends and their impact on companies’ earnings prospects.
The COVID-19 recession in 2020 created a well-below-trend year in economic growth and, in general, corporate earnings growth.
2021 is very likely to be a well-above-trend year in both the economy and for corporate earnings growth.
Probabilities suggest to us that economic growth will return to a slower pace of advancement next year. Likewise, 2021 harvest time for overall corporate earnings growth will give way to much more “normal”—although still solid—growth.
Did necessity during COVID-19 set the stage for a significant turning point in the U.S. economy?
Last year at this time the COVID-19 mandated shutdowns were taking hold, the economy was cratering, stock prices were under assault and things looked very bleak.
In that quarter’s edition of our Perspective, we made comparisons with the early days of World War II noting how ill-prepared the U.S. was to fight the military might of the Japanese and Nazis.
We entered ready for World War I, horse-drawn cannons and all! After stumbling about early on, the gap in naval strength relative to the Japanese was closed during the Battle of Midway. That battle was a critical turning point militarily (and within the stock market) for the U.S. against the Japanese.
Similarly, an important turning point against the Nazis occurred in the fight for supremacy of the North Atlantic. Technology was developed that transformed the U.S. (in the words of the commander of the Nazi U-boat fleet) from being the “hunted” to “becoming the hunters” of German U-boats on the North Atlantic. Dominance over the U-boats allowed key re-supply shipping lanes to reopen for Allied forces.
With the passage of time, we believe there is a good chance the battle against COVID-19 will also be looked upon as a significant favorable turning point. Take the vaccines for example. Out of necessity, innovations in biotechnology and genomics allowed them to be both developed and available within a timeframe that seemed like fantasy a year ago.
Also, out of necessity, productivity-enhancing technology was super-spread across the economy. And there’s much more in the wings with AI (artificial intelligence) embedded software, big data analytics, more SaaS (software-as-a-service offerings), 5G, edge computing, IOT (internet of things), digital twin technology, direct digital manufacturing, deep learning, low-code and no-code software…and a host of productivity-enhancing technologies and potential medical breakthroughs that are in early stages of development.
Roaring 20s? Depends upon the definition of “roaring”.
Whether this all will be sufficient to drive a “roaring 20s” depends upon the definition of “roaring”. We think productivity growth in the years ahead will be better than it has been in some time. But for context, even the optimistic productivity forecast referenced previously in Chart 1 is well below the rates achieved in the 1920s.
Also, two “wet blankets” on future productivity growth are winding their way through Washington D.C.—namely tax hikes and government-directed “infrastructure” spending. This is not intended as a political statement, but as an application of “first principles” within economics.
Taking resources from the more productive private sector, only to be directed by the less efficient government sector, is not helpful from a productivity standpoint.
Inflation: transitory or an important turning point?
Over the course of 2021, inflation statistics are almost certainly going to register a material advance compared to 2020.
The rise will, in part, be the result of negative inflation readings during some of the months of 2020 when mandated business shutdowns were most significant (last spring and again in the autumn).
Measured off a depressed “base”, 2021 inflation data will likely show a meaningful acceleration. In addition, it’s likely that some of the upward price pressures associated with pandemic-induced supply chain logjams will also contribute to inflation’s rise.
Fed Chair Jerome Powell insists the Fed can tolerate “transitory” inflation rates above their 2% (per annum) inflation target.
Is this simply wishful thinking by the Fed? Is the economy at an important turning point towards runaway inflation as the robust growth in traditional money supply figures suggest?
We believe that inflation will move up as the economy rebounds from the COVID-19 recession. But probabilities do not favor a major turning point towards higher inflation in our estimation.
Here’s why.
Inflation is not solely a monetary phenomenon.
Adherents to the quantity of money theory (generally known as “monetarists”) believe that inflation is solely a monetary phenomenon. In other words, inflation is caused when central banks print (create) “too much” money.
However, there is compelling evidence that context matters in the money creation-inflation relationship. The underlying structure of an economy can either amplify or dampen monetary traction.1
Jamie Dimon, CEO of the largest bank in the U.S., has noted that the bank was struggling to make profits on customers’ deposits with the bank. “Money” sloshing around the financial system appears not to be getting sufficient traction to ignite a great deal of inflation.
Why not?
The underlying economic structure does not appear inflation prone.
Geologists tells us that the earth’s surface is constantly being shaped by sub-surface tectonic plates that are on the move. Similarly, powerful underlying long-term trends are presently at work altering the economy’s structure.
Today’s economy is much, much different than the economy that existed during The Great Inflation of the late 1960s-early 1980s.
Two of the big forces shaping the current economy’s underlying structure are demographics and technology. The good news is the current economy appears much less inflation prone due to these two dynamic factors.
Let’s take a look at both of these factors.
Technology
The productivity growth we discussed earlier will help mitigate cost pressures some companies are experiencing. As the quote from economist Ed Yardeni suggests, much of today’s technology is deflationary.
“The price of information is deflating. As it gets cheaper, it also becomes more useful for increasing the productivity of the other factors of production, especially labor and capital. Increasingly, real-time information can also be a substitute for labor and capital, and even land, in the production process. That is truly revolutionary.” —Ed Yardeni2
The economy is becoming much more about “bits and bytes” and incrementally less about tangible assets. Building out the digital economy of bits and bytes requires much less capital. Bits and bytes scale easily and are not subject to the law of diminishing returns that rules the physical asset world.
Inflation prospects reflect a mix of pressures from supply chain kinks and deflationary forces of technology. In time—likely as soon as the back half of 2021—some alleviation of supply chain pressures should occur.
Demographics
Chart 3 below presents the demographic backdrop underlying the U.S. economy. Today’s situation is significantly different than that which prevailed during The Great Inflation.
Plotted within Chart 3 is the year-over-year rate of change in the population of key spenders within the U.S. This group represents people in their prime working and spending years which is generally recognized by economists as those in the 20-64 years old category.
This group is a reasonably proxy for consumer demand within the economy.
We have placed lettered arrows reflecting notable trends that have occurred within this prime spender population since World War II.
Chart 3: Tracking the growth of key spenders over time
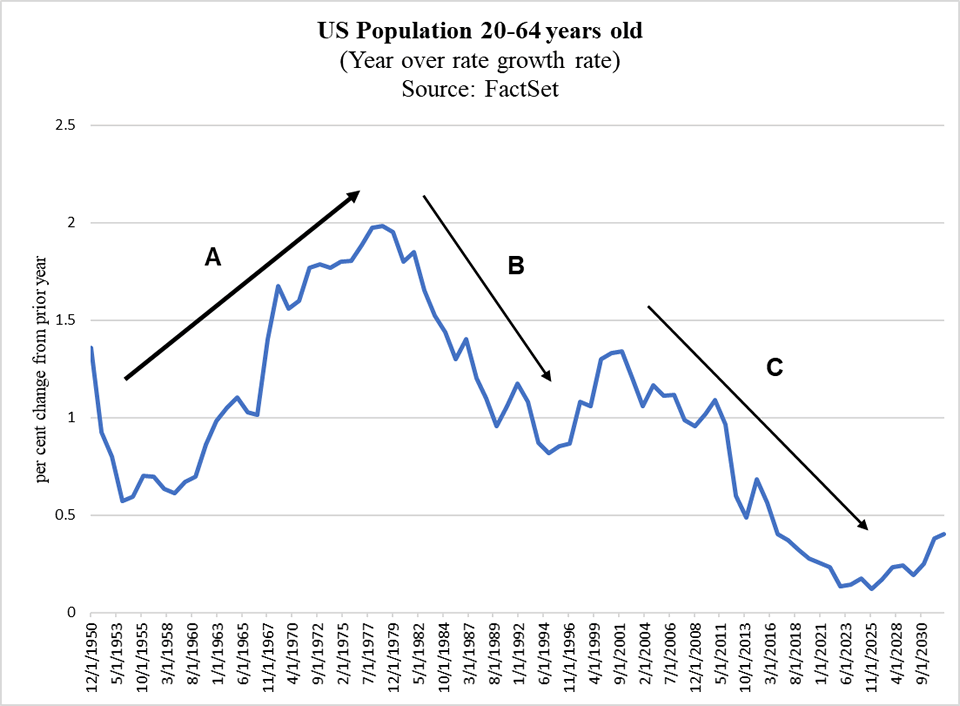
As the chart suggests, the defining post-War demographic event was the baby boom “shockwave”. How big was this shockwave?
The answer is “huge”. In 1945 the population in the U.S. was approximately 140 million. Birthrates began to surge in 1946 – the year generally regarded as the beginning of the baby boom. The baby boom added nearly 80 million by the end of 1964. (Birth rates declined notably after 1964, so demographers generally date that as the end of the baby boom).
Arrow A in the chart captures the emergence of the baby boom coming of age as key drivers of consumption as they entered the 20-64 years old group.
Note that Arrow A also coincides with The Great Inflation period discussed earlier. We think this is much more than mere coincidence.
The baby boom represented a huge demand shock to the economy as they became key spenders. It’s sheer magnitude made the economy extremely vulnerable to inflationary pressures.
The Fed, meanwhile, readily expanded the money supply to accommodate the increase in consumption of these key spenders.
The Fed’s money printing caught traction and the outcome was too much money chasing too few goods (relatively speaking, of course) as production capacity was constantly strained to keep up with the explosion of demand.3 The fire of inflation was continuously burned hotter during this period.
Note that The Great Inflation crested in the early 1980s as the intense demographic demand pressures finally abated. In addition, the Federal Reserve (then led by Paul Volcker) went all-in with policy designed to crush inflationary expectations. Volcker’s policies resulted in some of the highest interest rate levels in the history of the country and triggered two recessions in rapid sequence.
With the break in the inflation fever, and the help of pro-growth policies out of Washington D.C., the decade of the 1980s was marked by both growth and dis-inflation, much to the surprise of many pundits at the time.
As Chart 3 also reflects, although the key spender group and their demand continues to grow (the blue line remains above the zero threshold), the rate of growth in demand is much slower today than it has been over the post war period.
Economies tend to grow more slowly as population growth slows. The rate of incremental demand wanes as the pace of “incremental people” wanes.
The U.S. has been stuck in the slow growth (relatively) low inflation lane for an extended period of time, as arrows B and C suggest.
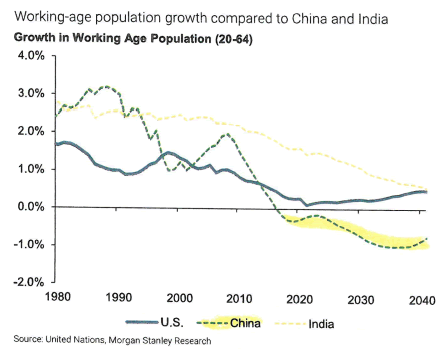
Importantly, this is not just an U.S. phenomenon. Slow economic growth, modest (if any) inflation and outright declines in the key spenders/workforces are occurring in the other major economies around the world—China included (see Charts 4 and 5 below).
Chart 4 (Footnote4 below defines “G10” countries)
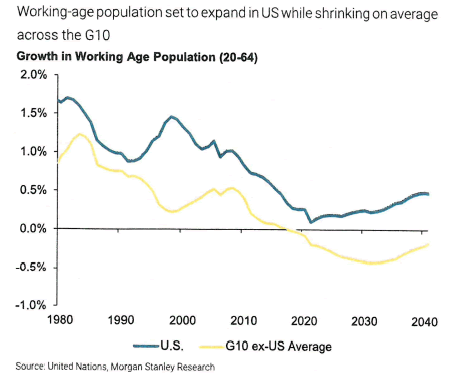
Chart 5
We believe the prospective demographic situation has profound implications for inflation, interest rates and long-run backdrop for corporate earnings growth.
A book we have referenced on previous occasions provocatively notes:5
“The great defining event of the twenty-first century—one of the great defining events in human history—will occur in three decades, give or take, when (not just the developed world but) global population starts to decline. We do not face the challenge of a population bomb but of a population bust—a relentless, generation-after-generation culling of the human herd. Nothing like this has ever happened before.”
This book points out the situation in Japan which is on the leading edge of a trend dealing with demographic challenges for its economy:
“Japan’s economy has been mostly stagnant for going on three decades in part because its aging population consumes less and less, leading to less and less demand, and fewer and fewer start-up loans from banks rightly worried that demand is only going to continue to fall.”
“The (Japanese) government responded by pouring billions into infrastructure to jump-start the economy. That Keynesian approach might have made things worse by starving the market of private capital. It’s made Japan the most indebted nation on earth.”
“Japan’s population is expected to decline by 25 percent over the next thirty-five years… The numbers are similar for South Korea and Singapore.”
The outright population declines facing the European Union (“EU”) are not yet as severe as they are in Japan, South Korea or Singapore. But as Chart 4 (above) reflects, the demographic growth challenge to EU countries is intensifying.
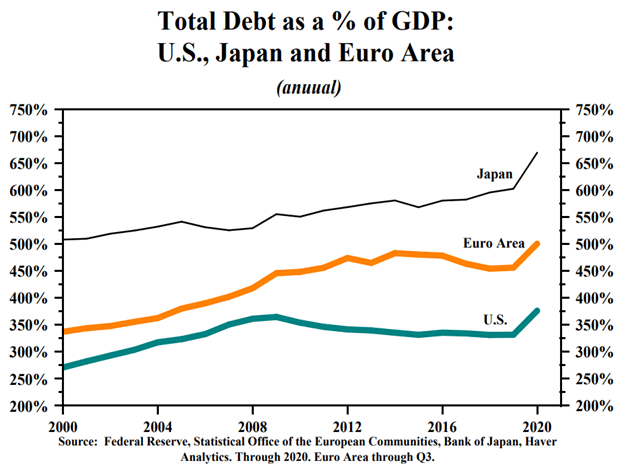
Like Japan, collectively, the EU has made government debt issuance, and a negative interest rate policy from their “Fed” (The European Central Bank) key planks in their economic stimulus approach. As is the case in Japan, these policies are getting little traction. The result for the EU has been tepid economic growth, little to no inflation, and heavy government debt loads. (See Chart 6 below).
Chart 6: Big government debt expansions haven’t “stimulated” much economic growth
(Source: Hoisington Investment Management)
“We have tried spending money. We are spending more money than we have ever spent before, and it does not work… We have never made good on our promises… I say after eight years of this administration, we have just as much unemployment as when we started… And an enormous debt to boot!”
—Henry Morgenthau, Jr. (FDR’s Secretary of the Treasury from 1934-1945)6
The bottom line on demographics
Demographics suggest the world will remain growth-starved and yield-starved. Inflation is likely to remain like a wet log in this environment—smoldering but hard to ignite.
The good news is that U.S. demographics are more favorable than what other major economies are encountering. Instead of an outright decline in the key spender population that is happening elsewhere, demographic factors should continue to support modest growth in the U.S.
Harvest time…a turning point at hand?
Economic and corporate earnings growth will likely be harvest-time abundant in 2021. Bond yields may even move higher as inflation anxiety remains and may even intensify.
But as the year progresses, the “markets” will be looking ahead towards what likely comes next. We believe the structural backdrop underlying the economy favors a return to modest economic growth and wet log inflation.
Probabilities do favor an important turning point within the economy, however. The COVID-19 recession triggered important behavioral and mindset changes that opened the floodgates towards the mass adoption of productivity enhancing digital tools.
Nearly every business is becoming a “tech company” running on an infrastructure powered and empowered by digital tools to better serve their customer (and society’s) needs and desires.
We noted earlier a great deal of additional digital tools is in the pipeline. Many of the companies we own are among the leading tool providers. Their durable growth profiles and strong financial flexibility should continue to reward investors.
Appendix: Why is growth so important?
We are sometimes asked why economists and investors are so “obsessed” with growth. At the economy level a key determinant of economic growth is productivity. Productivity growth ultimately drives wages and the general standard of living higher. If an economy can grow at say, a 2% per annum real (after inflation) rate versus a 0% rate, over a typical life span of say, 80 years, the general standard of living would be close to 5 times higher in the growth case versus the no growth case. In our book, that’s a big deal!
On a more concrete level, consider what seems like the “overnight success” stories of the COVID-19 vaccines. The innovation underlying the vaccines is the result of years of experimentation. Without the push to innovate and grow, new solutions to society’s problems would stagnate.
Regarding stock investor sensitivity to corporate earnings growth; a company’s stock price is a function of the earnings power of the underlying business. In essence, earnings are the “cause” with stock price the “effect”. Strong earnings growth thus helps maximize the probability of investment success.
Sources & Notes
1 See for example, The Great Wave, Price Revolutions and the Rhythm of History, by David Hackett Fischer, Copyright 1996, Oxford University Press, and The Fed and the Great Virus Crisis, by Ed Yardeni and Melissa Tagg, Copyright 2021, YRI Press, or see the work of economist/demographer Richard Hokenson.
2 Ed Yardeni, Predicting the Markets: A Professional Autobiography, Copyright 2018, YRI Press.
3 The Great Wave, Price Revolutions and the Rhythm of History, by David Hackett Fischer, Copyright 1996, Oxford University Press, provides detail from this time period.
4 Although called the “G10” for group of 10, it is comprised of the 11 countries: U.S., U.K., Japan, Canada, Germany, France, Belgium, Italy, Netherlands, Sweden, and Switzerland.
5 Darrell Bricker and John Ibbitson, Empty Planet, Copyright 2019, Crown/Penguin Random House.
6 Burton Folsom Jr., New Deal or Raw Deal?, Threshold Editions 2008.