“The stock market increased nearly 119-fold in the past 50 years. All you had to do was sit back and let your money compound. ‘Hold stocks for the long run,’ you’ll hear. It’s good advice. But do you know how hard it is to maintain a long-term outlook when stock prices are falling?”
This quote is from Morgan Housel and his 2020 book The Psychology of Money. We’ve referenced the book on prior occasions and feature the above quote for it reflects the great conflict that’s once again confronting investors.
The conflict is between investment time horizons—the short-term vs longer-term.
In the longer-run, the power of compounding can help drive incredible wealth accumulation that comes from investing in exceptional businesses.
So potentially powerful is compounding that Einstein is reported to have called it one of the wonders of the world.
But…compounding requires time to work its magic.
“Being patient and thinking longer-term are often discussed as positive investor attributes,” notes investor John Huber. “Although widely talked about, it does not mean they are widely practiced.”
Why is that the case?
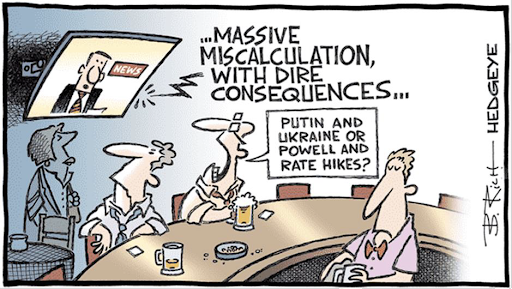
In large part, it’s because of periods—like now—when FUD (Fear, Uncertainty and Doubt) is intense as the daily news typically ranges from distressing to downright scary. War, highest inflation in decades, tough talk from the Federal Reserve (Fed) about “tightening” monetary policy, falling stock and bond prices, to name just a few items.
The emotional power of today’s bad news can win the tug-of-war conflict to the detriment of the power of compounding and longer-run investment objectives.
Fight or flight? When people are frightened and feel they have little or no control over the events driving heightened and pervasive FUD, doing something (“flight”) seems like an appealing investment action.
Why not just sit on the investment sidelines until the coast is clear?
Accomplishing that feat successfully is a very low probability proposition. Very rarely is the coast ever “clear.”
To paraphrase (in G-rated fashion) historians; life is just one darned thing after another.
Consider Chart 1 below.
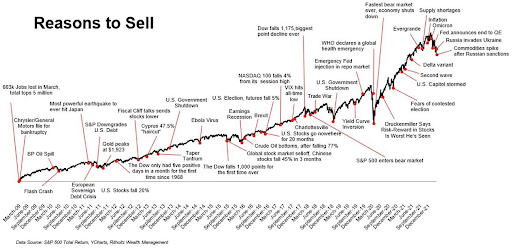
Last quarter’s Perspective, “Fed FUD and Expiring ‘Knowledge’”, referenced economist Ed Yardeni’s on-going list of episodes of intense fear, uncertainty and doubt that have occurred since the U.S. stock market began its advance in the wake of the Financial Panic of 2008-2009.
Chart 1 is essentially Yardeni’s list along with the stock market advance over the period since 2009. (The wiggly line in the chart reflects the stock market).
It’s hard to even recall many of the events noted in the chart, because the considerable FUD that existed at those moments dissipated and new “things” to worry about emerged.
Ultimately, each of the problems did not prove as insurmountable as feared—despite lots of pessimistic and skeptical narratives to the contrary at the time.
The U.S. economy muddled through each time, providing more grist to an old Wall Street saying that “the stock market climbs a wall of worry.”
We think the brevity of this old saying obscures the underlying dynamic at work. Given the cause-and-effect relationship between the earnings power of businesses (the cause) and stock prices (the effect), the saying should be, “the earnings of exceptional companies enable the price of their stocks to climb a wall of worry.”
Could things be different this time?
We believe the chart reflects the low odds of attempting to “time” the market by getting out when there’s trouble and getting back in when the coast is clear. But could it be that the period since 2009 is not a good script for the problems investors are now facing?
After all, the most recent entries on Yardeni’s FUD episode list—inflation, war, and the Fed—are “new.” Or are they?
Let’s expand our frame of reference.
What follows is a quick look back at significant historical events as seen through an investing lens.
Although there was a great deal of volatility along the way in each of these incidents:
- From the start of the World War I in 1914 until the war ended in late 1918, the U.S. stock market was up around 9% annually.
- From the start of World War II in 1939 until it ended in late 1945, the stock market rose more than 7% per year.
- U.S. troops were sent to Vietnam in March of 1965. By the time, the last of the U.S. troops were pulled out in 1973, stock prices in the Dow Jones Average were up around 5% per year.
- The Cuban Missile Crisis had the world on the brink of nuclear war in October of 1962. The confrontation lasted several weeks but the Dow remained surprisingly calm, losing just over 1%. For the remainder of that year the Dow gained more than 10%.
- President John F. Kennedy was assassinated a little more than a year later in Dallas. Stocks finished up the following year, 1964, more than 15%.1
What about the time since then? Consider Chart 2.
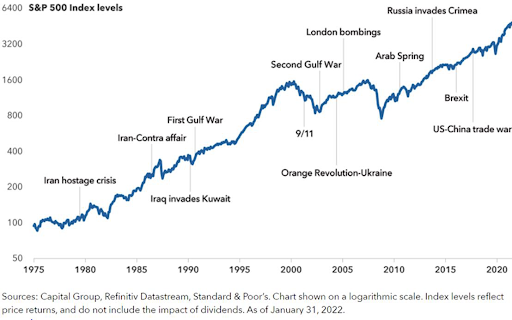
Chart 2: Stock markets have historically powered through geopolitical events. Chart 2 roughly covers the 50-year period that was the basis for the opening Housel quote during which stocks went up 119-fold.
This quick look back at history encompasses periods of war and peace, high interest rates, low interest rates, high inflation and low inflation, different people in the White House and Congress, recessions that interrupted corporate earnings growth for a time and economic expansions.
Investors had to endure plenty of volatility along the way but those that endured were well rewarded.
Investment time horizons
 Some readers might be thinking, “but my investment horizon is much shorter than 50 years.”
That may be so, and that’s one of reasons we cast part of our historic review of past geopolitical troubles in relatively short time frames (those periods denoted by the letters a-e presented earlier).
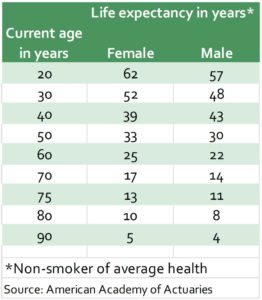
Also, consider the table to the right. Life expectancies, even for folks that may no longer regard themselves as “spring chickens,” still have investment horizons that span multiple years or multiple decades.
In addition, the relevant investment time frame may also be longer when an investor’s desire includes leaving a legacy to others with even longer investment horizons.
In other words, horizons are sufficiently long enough to have ownership of exceptional businesses and compounding work their magic.
“Darkest before dawn” sentiment levels?
Before we move too far from the history review portrayed earlier, let’s view the current FUD through a different historical lens.
Beginning in the 1960s, the University of Michigan conducted surveys assessing consumer sentiment about financial and economic conditions. The following chart (Chart 3) plots the University’s Consumer Sentiment Index over the decades. The chart also includes subsequent 12-month returns in the domestic stock market from key Sentiment levels.
As Chart 3 reflects, the current reading is approaching the most extreme pessimistic “lows” reported in the Sentiment Survey’s long history.
Moving from the most recent backwards, the extremes include:
- the summer of 2011 (U.S. debt downgrade and widespread fears of a Eurozone debt crisis)
- the Financial Panic of 2008-09 (which we mentioned earlier)
- the (first) high inflation recession of the 1980s
- the (very severe) recession that occurred in the mid-1970s
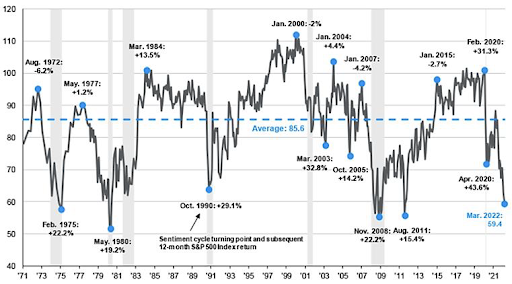
Shaded areas denote recessions.
As the chart displays, from these prior low points—when the future looked hopelessly bleak—the stock market recovered, and investment returns proved very rewarding.
Are we nearing a point of maximum pessimism currently?
The Seduction of Pessimism
Speaking of pessimism, a client who had recently read Housel’s Psychology of Money book told us he found the chapter entitled the Seduction of Pessimism very worthwhile.
With this (and the thick FUD around us all) in mind, we thought the following excerpts from this chapter might be of broader interest:
“Pessimism sounds like someone is trying to help you. Optimism sounds like a sales pitch.”
“Pessimism isn’t just more common than optimism. It sounds smarter. It’s intellectually captivating, and it’s paid more attention than optimism, which is often viewed as being oblivious to risk.”
“The interesting thing about (pessimistic narratives) is that their polar opposite—forecasts of optimism—are rarely taken as seriously as the prophets of doom.”
“Take Japan in the late 1940s. The nation was gutted by defeat from World War II in every way—economically, industrially, culturally, socially. A brutal winter in 1946 caused a famine that limited food to less than 800 calories per person per day.”
“Imagine if a Japanese academic had written a newspaper article during that time that said: Chin up everyone. Within our lifetime our economy would grow to almost 15 times the size it was before the end of the war… Before long we will be so rich, we will own some of the most prized real estate in the United States. Americans by the way, will be our closest ally and will try to copy our economic insights.”
“(The academic) would have been summarily laughed out of the room and be asked to seek medical evaluation.”
“Keep in mind this description is what actually happened in Japan in the generation after the war.”
Particularly important in our view is Housel’s definition of optimism:
Foundation of optimism = economic dynamism
What twists and turns are ahead in the Russian-Ukraine war? We continue to read and listen to lots of pundits, policy “experts” and macro-strategists on possible implications associated with Putin’s invasion of Ukraine.
All we can say for certain is that no one really knows what’s ahead.
But we believe there are important aspects of the present environment about which we can be much more certain.
The foundation of optimism that Housel alluded to remains a central feature of the U.S. economy. The process he describes as “the simple idea that most people wake up each morning trying to make things a little better and more productive,” we have called economic dynamism on numerous previous occasions.
Dynamism is driven by human ingenuity. It powers innovation, change, adaptation, improvement, and advances economic wellbeing over time. It’s the secret sauce behind our economy…apparently so secret that many policymakers here and abroad fail to understand or appreciate its importance.
If one believes—as we do—that there will be many tomorrows ahead for humanity, then as crazy as it may sound to some, there are rational reasons to be optimistic about the future. And here we mean optimism as Housel defines it: odds of a better future despite periodic setbacks (like the current one).
Here’s why.
There are many signs that dynamism remains busy at work trying to make better tomorrows.
While the headlines of the day fill one’s ears with narratives around the host of troubles facing us all, at the company level we hear of initiatives to try to make lives better. The innovation of problem-solving products and services is the business model of most exceptional companies. As we’ve noted in the past, the efforts underway at many firms are altering the structure of the economy in ways that will likely amaze and delight many in the extended future.
Consider some areas where dynamism is at work:
Supply chains
Some companies are simply increasing inventory levels as a short-term “fix” to product shortages that have raged due to pandemic shutdowns. (This inventory building may be aggravating the inflation problem, by the way).
But those seeking longer-run solutions remain in the process of “reshoring” production and/or transitioning supply chains into much more resilient webs.
Some may also be following a path blazed by Illinois Tool Works (a long-term portfolio holding). ITW largely sources inputs in the geography where they sell their products. For businesses worried that changing from current supply chain arrangements will increase their costs, we’d point out that ITW’s profit margins have long been the envy among industrial companies. Exceptional companies figure out a way forward.
Container Ships Anchored Outside of U.S. Ports
How potentially significant can the evolving product process adjustments end up being?
Economist Nancy Lazar of Cornerstone Macro has done some interesting research in this area. She calls the U.S. Midwest her favorite “emerging market” for investing. She believes reshoring, supply chain webs and high-tech manufacturing have the potential to revitalize what has (for too) long been called the “rust-belt.”
Meanwhile, there are indications that supply chain bottlenecks are easing (Chart 4). This is good news for inflationary pressures.
“Tight” employment markets and dynamism
Perhaps you’ve seen stories about “Flippy” and “Chippy.” These are the names of flexible industrial robots being deployed within the fast-food industry. Flippy is doing the menial tasks of flipping burgers and fries while they cook for White Castle. Chippy helps Chipotle make chips quickly and safely. These initiatives are augmenting labor while freeing employees’ time up for value-added functions.
Many more solutions (including avatars from Nvidia) are on their way to help businesses deal with rising labor costs which are likely to be a persisting issue due to demographic trends.
Cost-push inflationary pressures and dynamism
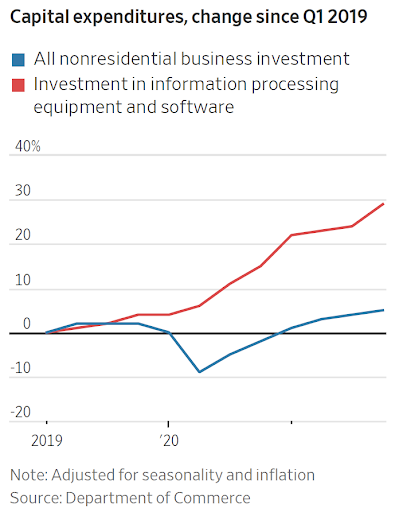
Productivity software spending
uptrend…
Inflation intensifies the pressure on businesses to improve the productivity of their operations. Unlike the inflationary 1970s when productivity growth was negligible, today there are numerous effective productivity-enhancing tools to help businesses mitigate cost pressures.
As we’ve noted in the past, a number of our portfolio companies are providers of today’s “tools” that are increasingly becoming essential infrastructure for most businesses’ operations.
Over time, it’s productivity growth that powers the overall standard of living higher. So, the more pervasive productivity enhancing tools become throughout the economy, the better!
Dynamism is at work within markets
Prices act as signals of shortages or surpluses within a market-based economy. Their signals cause consumers, businesses, and employees to adapt to market conditions.
As some economists note, in most circumstances rising prices are the ultimate remedy for rising prices. As prices rise, they induce “demand destruction” (demand cools as prices rise) at the margin while increasing the incentives of bringing new supply into the equation.
For example, we noted earlier that port congestion is lessening. The considerable incentives to move goods ashore are slowly—but relentlessly—working.
In similar fashion, consider freight trucking. Over the past couple of years, there have been numerous stories about shortages in the trucking industry.
As driver pay and shipping rates soared, guess what has happened? New drivers and rigs have been attracted to the freight market.
FreightWaves is a firm that offers freight market insight from data for shippers. Here are highlights of their March-end comments on the trucking markets:
- Trucking has enjoyed the largest number of new entrants in its history over the past two years. New fleet registrations were up to 20,166 last month alone. This is unprecedented.
- Trucking spot rates are under (downward) pressure, caused by too many trucks and not enough freight.
- Market participants are confirming what FreightWaves analysts are seeing in the data. Spot rates (for trucks moving freight) are falling, and volumes are dropping.
- The COVID-19 surge in goods is largely behind us and consumers are starting to shift their spending away from physical goods to travel and entertainment.
In a recent interview on CNBC, the head of Uber Freight indicated they are “seeing” these trends as well.
Another example of dynamism at work is within the markets for used vehicles. As we discussed last quarter, used car and truck prices (up nearly 40%) have had a significant impact on the rise in the Consumer Price Index (CPI) over the past year.
There are signs the upward thrust in used car prices is reversing (Chart 6) which has some potentially favorable implications for the CPI.
Also, the Fed’s tough talk on potential “tightening” of monetary policy is impacting more than just the bond market.
Rising mortgage rates already appear to be cooling housing market activity and will likely slow the ascent of home prices. Meanwhile, high rental rates have created incentives for new rental supply. A record amount of new multifamily housing units is poised to come onto the market (Chart 7).
The FUD surrounding Fed and inflation
It strikes us that the Fed is doing the opposite of Teddy Roosevelt’s “speak softly but carry a big stick” approach to policy.
The Fed is speaking forcefully about numerous future measures they may take to cool inflationary pressures. Meanwhile the bond market is doing the Fed’s bidding by “pricing in” the Fed’s tough talk within the bond market.
The more prospective future “tightening” measures get priced into markets, the less follow through may actually be necessary from the Fed. And the bond market already has a great deal of potential tightening “baked into the cake.”
Still, bond yields and mortgage rates will remain under upward pressure until the bond market senses that inflation is peaking.
When will that be? Like the question we posed earlier (and conveniently left unanswered)— about the point of maximum pessimism—the answer(s) will only be clear in hindsight.
However, there are some potential signs that the point of maximum inflation pain may be in sight. Yes, the war and its impact on energy and food prices as well as the recent COVID-19 shutdowns in China all exacerbate inflationary pressures. But as we noted in our market dynamism discussion, some of the pandemic related inflation shocks to the demand and supply of goods are showing signs of dissipating.
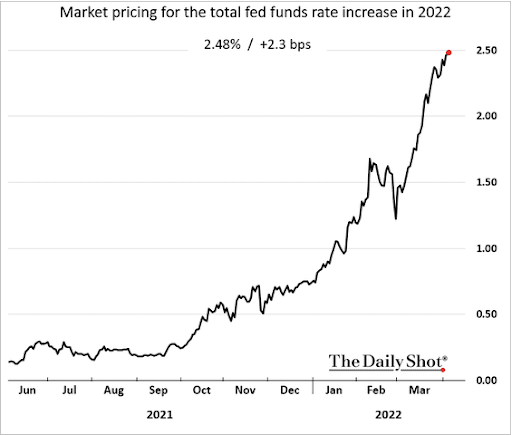
Within the Treasury bond market, the yield on the 2-year Treasury notes has historically been one of the best indicators of Fed rate policy over the next 12-months. The current 2-year note yield is implying the Fed will lift rates under its control to 2.5% (as Chart 8 shown earlier implies).
When the 2-year yield exhibits “peaking behavior” odds are good that the market is sensing Fed policy tightening is nearing its maximum intensity. The bond market will be hyper-sensitive to upcoming economic growth and inflation indicators. We’ll be constantly evaluating these developments as well.
Why might the Fed be talking tough and hoping to have the bond market continue to do its bidding? We suspect they are trying to avoid the “fool in shower” behavior exhibited by their 1970s predecessors. By this we mean turning the monetary spigot too far in one direction and trying to then compensate by turning too far in the other direction.
If one believes, as we do, that the COVID-19 shutdowns and their inflationary impulses are interruptions to the inherent deflationary impact of the longer-term forces shaping the economy—technology, demographics, and heavy debt loads—the Fed wants to be careful not to overreact too much to today’s inflationary pressures.
Meanwhile, the rise in bond yields is no fun right now for bond investors—but it is altering the risk/reward profile of shorter-term bonds in a favorable way. As yields rise, future returns increase, and the prices of short-term bonds become less susceptible to the additional pressure of rising rates.
With the rise in yields that occurred in recent months, as the year progresses the short-term orientation of our bond holdings should demonstrate increased “shock absorber” like properties for portfolios.
How high will rates and yields ultimately go? We suspect they will ultimately settle at rates that continue to remain relatively low in historical context as deflationary forces shaping the economy reassert dominance.
The FUD surrounding stock prices
Stock price weakness in general, and particularly in the shares of secular growth businesses we favor, has been the early story for 2022. Chart 9 reflects the contrast between the downtrend in stock prices while earnings prospects of the underlying businesses are rising.
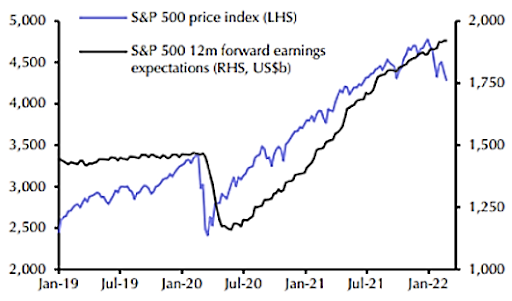
This situation suggests that an easing of FUD intensity could easily trigger a stock price reversal.
Some are increasingly concerned a U.S. economic recession is ahead which could mean earnings growth disappoints.
The probability of recession has likely risen of late, but we believe the economy remains sufficiently resilient to avoid a serious recession.
We suspect slow growth is more likely as demand for goods moderates. The economy muddles through and corporate earnings grow. The best defense for a stock investor against the current FUD is owning companies whose earnings will grow faster than inflation.
Before we close, we want to emphasize a point related to dynamism and stock investment selections. If a business fails to maintain a durable competitive advantage, an exceptional company today risks becoming an average company (or worse) in the near future. The “picnic” enjoyed by an exceptional business always attracts many “ants” (rivals).
As a result, even as we believe a significant investment edge can be gained by thinking long-term and exercising patience, dynamic evaluation is required of all our investment holdings. In our search for exceptional businesses, we constantly have to assess and reassess if they are losing their exceptional characteristics.
While some selections will fall short of our expectations, we believe our current stock investments as a portfolio are characterized by exceptional businesses that have durable fundament strengths including:
- High recurring revenues
- High profit margins due to superior approaches being taken by their management teams
- Ability to generate superior earnings growth and free cash flow
- High levels of financial flexibility to take advantage of opportunities to allocate capital to additional growth initiatives
As longer-term clients have experienced, if these businesses maintain these attributes they become compounding machines—generating cash that managements can profitably reinvest to extend their growth profiles into the future.
Conflict of horizons? The longer-run investment rewards remain significant, enduring the volatility along the way will be worth it.
Sources & Notes
1Sources: Wealth of Common Sense and Wealth blog by Ben Carlson and War and Wisdom by Barton Biggs, John Wiley & Sons, 2010